MENU
Toggle navigation
Home
Rankings
Data
Main Table
Regional Overview
Definitions
Datasheet 2016
Archive
Rankings
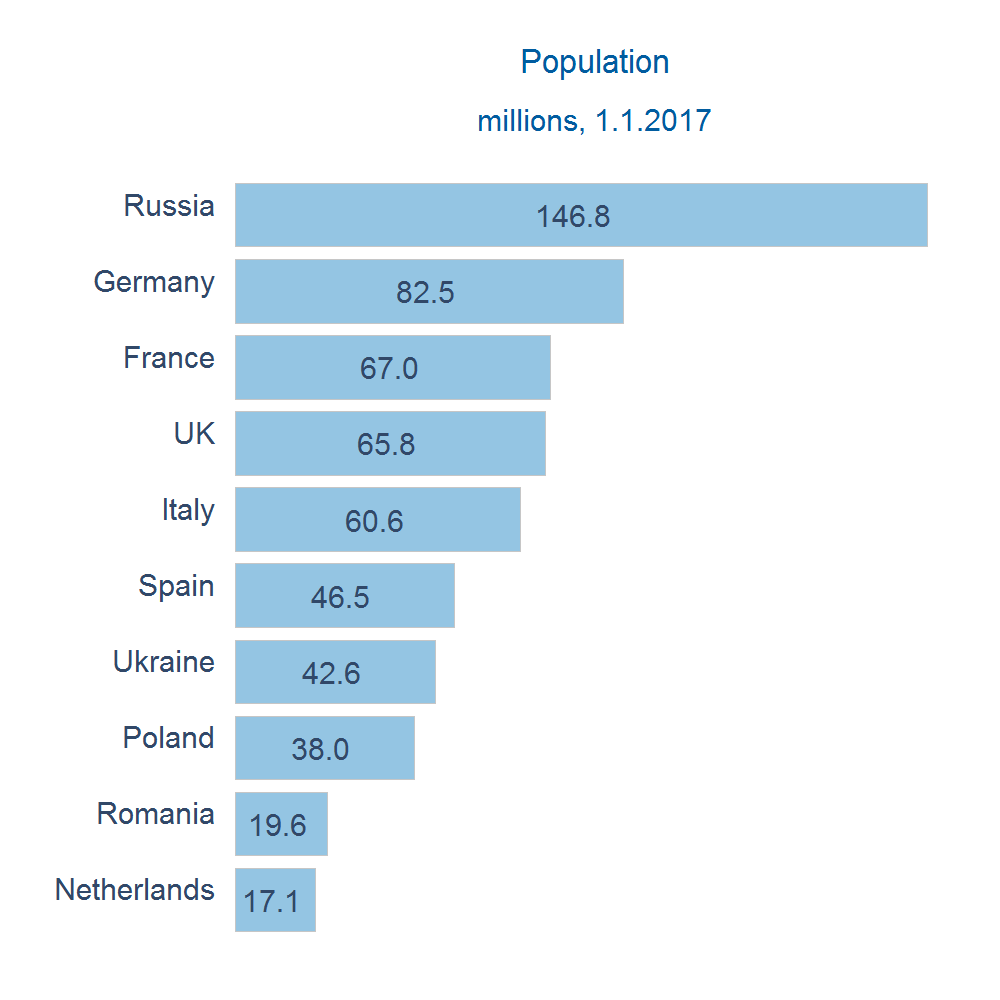
Population (millions), 1.1.2017
Population (millions), 1.1.1990
Natural increase (per 1,000 population), 2016
Net migration estimate (per 1,000 population), 2016
Proportion of foreign born population (%), 1.1.2017
Total population increase (%), 1990-2017
Total fertility rate (TFR), 2016
Tempo and parity adjusted TFR, 2014
Mean age at first birth (years), 2016
Completed cohort fertility, women born 1976
Cohort childlessness (%), women born 1976
Life expectancy at birth (years), Women, 2016
Life expectancy at birth (years), Men, 2016
Old-age dependency ratio 65+/20-64 (%), 1.1.2017
Healthy life years at birth (years), Women, 2015
Healthy life years at birth (years), Men, 2015
Share with post-secondary education, age 25-39 (%), Women, 2015
Share with post-secondary education, age 25-39 (%), Men, 2015
Share with post-secondary education, age 50-64 (%), Women, 2015
Share with post-secondary education, age 50-64 (%), Men, 2015
Labour force participation rate, age 20-64 (%), Women, 2014-2016
Labour force participation rate, age 20-64 (%), Men, 2014-2016
Labour force participation rate of post-secondary educated, age 20-64 (%), Women, 2014-2016
Labour force participation rate of post-secondary educated, age 20-64 (%), Men, 2014-2016
Employment based dependency ratio (non-employed/employed), 2015
Aggregate life cycle deficit of the elderly population, 2010
CLICK TO ENLARGE
GET THE IMAGE
X
+